Departures on-time performance Global ranking (FlightAware)
Our ranking as compared to airports worldwide. Movement down the list indicates improvements.
16
Down
25
Last updated Apr 19, 16:25
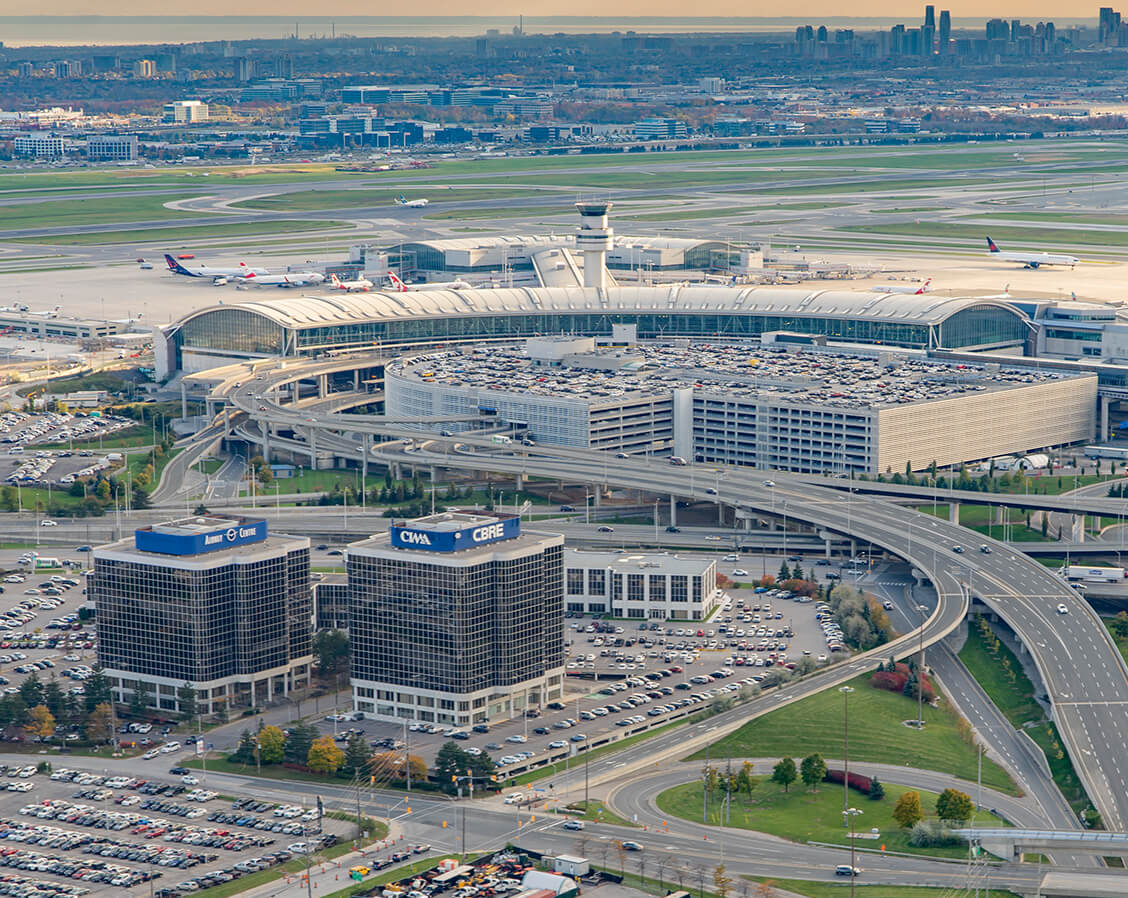
We publish press releases, guides and key data on airport events and operations to keep media and the general public informed.

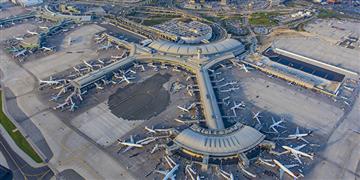
Toronto Pearson and all 400+ industry and government partners that operate as part of the airport ecosystem are working hard to improve the airport travel experience. To keep you informed of progress, we’ve collected information from across the operation in a single, at-a-glance resource which will be updated weekly and compared to a four-week rolling average.
Our ranking as compared to airports worldwide. Movement down the list indicates improvements.
The percentage of flights that departed/arrived at their gate within 15 minutes of scheduled time. Various factors impact on-time performance, including airline staffing, weather and other operational disruptions.
The percentage of flights airlines have cancelled.
Baggage delivery to and from the aircraft is managed by the airlines. The below data references the average length of time it takes for the first bag to be delivered to the carousel.
There are times when the Greater Toronto Airports Authority may hold passengers onboard their plane or in waiting areas to make room in the customs hall.
The below data references the number of international arriving flights held and/or metered and average hold times, including the number of passengers impacted.

Arriving on approximately 312 international flights, per day.


Count of flights where all passengers were held on the aircraft at the gate.

Count of flights held or flights where passengers were released in groups and metered by 5/10/15 minutes (Metering) or flights that were both Held & Metered.

Average time a flight was held.
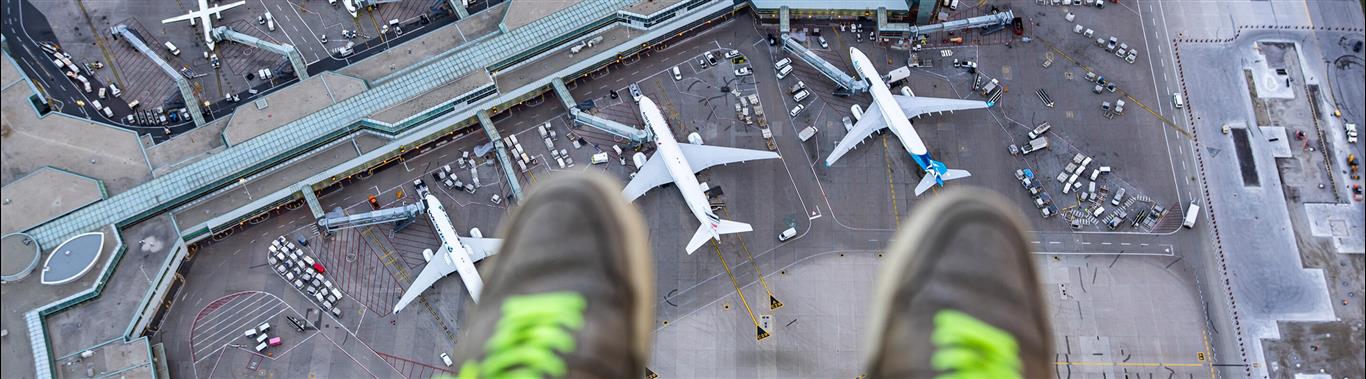
We're available if you have a media request or would like still images or b-roll footage for your publication. Or join our media list for airport news delivered to your inbox.
Media filming is welcome in the public areas of both Terminals 1 and 3. We can accommodate live media trucks and also provide staging areas in special circumstances.
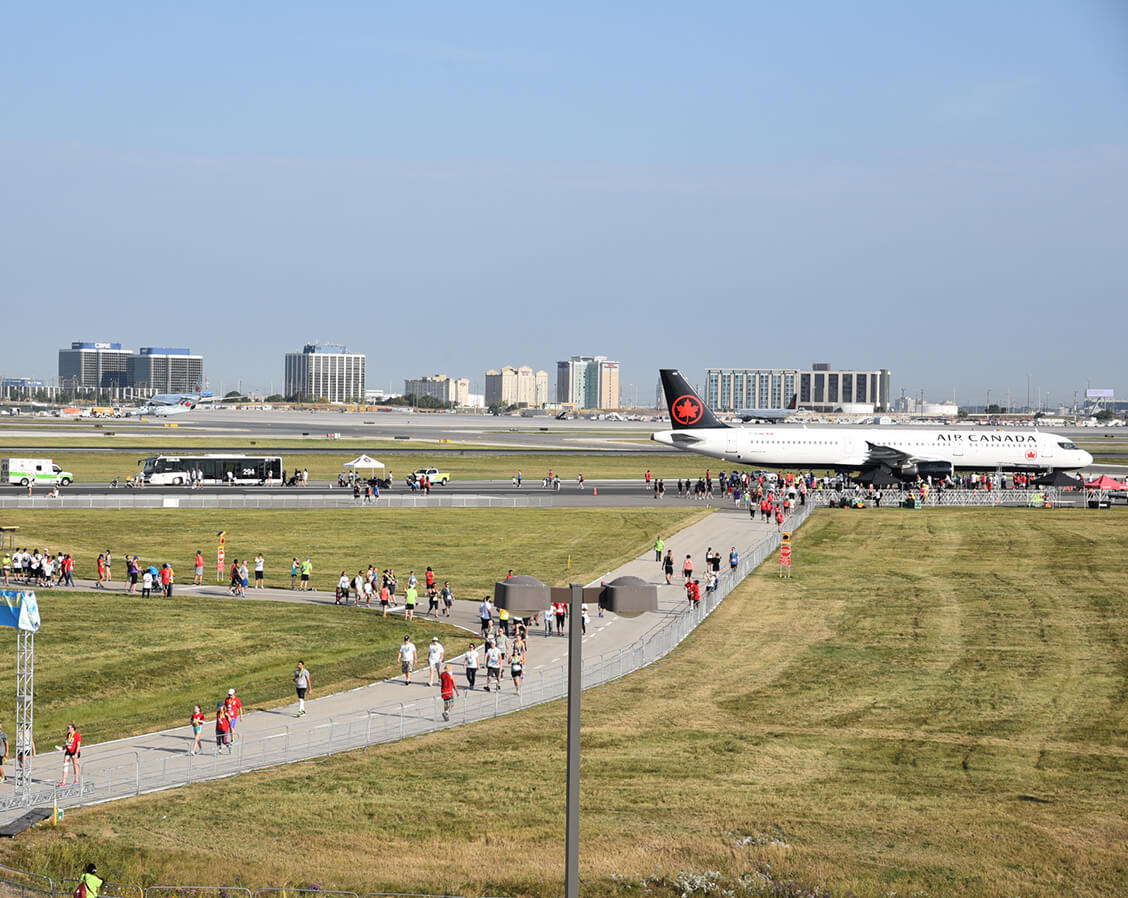
We are Canada’s front door and a neighbour to our surrounding communities. Learn how we invest in our communities through our Propeller Program, the Runway Run and community event sponsorship, forums, our noise management program and our environmental initiatives.
In the News